Issue Discovered
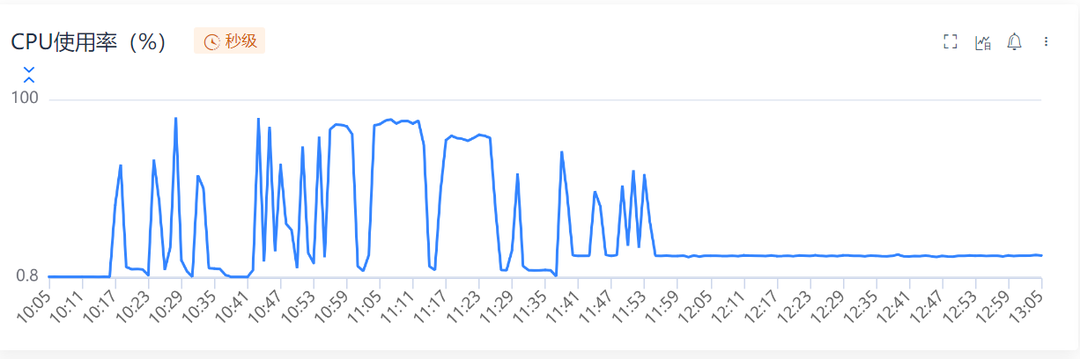
During business performance testing, it was observed that when the service is idle, the CPU usage remains around 10%, instead of dropping to approximately 0% as expected. Below, I document the process of debugging and investigating this issue using Galileo and the monitoring tools provided by Go.
Preliminary Assessment
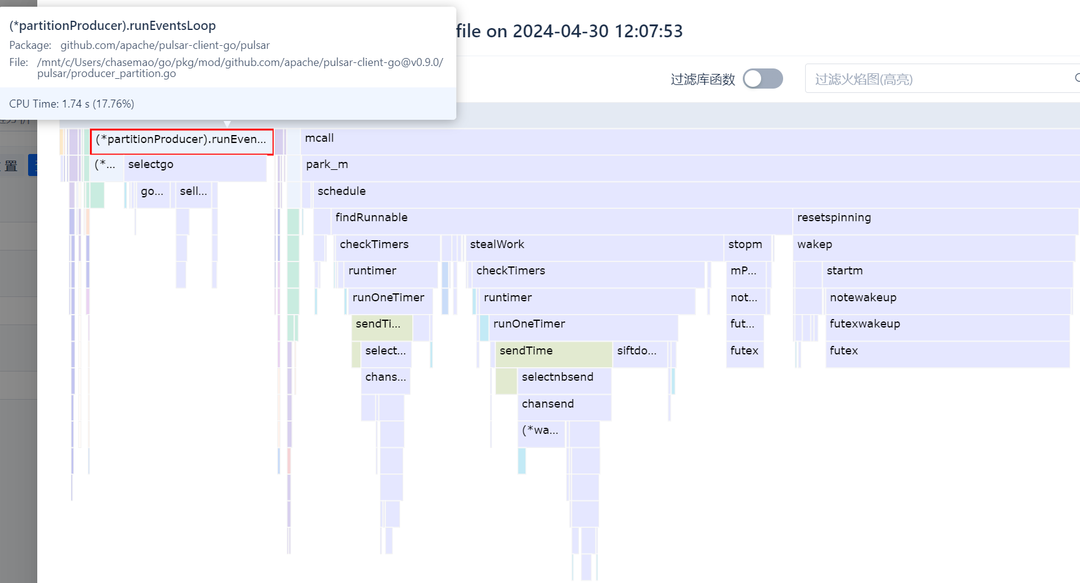
A common reason for non-zero CPU usage during idle periods is the presence of unremitting for loops that continually occupy the CPU. With a container specification of 8 cores, a CPU usage of 10% precisely equates to one core being fully utilized. To pinpoint which part of the code logic employs such perpetual for loops, flame graph analysis of the CPU execution stack can be employed. The results indicate that no business logic occupies the CPU; rather, only two segments do: the event loop of the message queue and the scheduling of the Go runtime. Both of these segments appear to function normally. Why then does the CPU usage persist at a high level?
Reanalysis
The speculation regarding the presence of unremitting for loops, as indicated by the flame graph, was incorrect. However, a new discovery has emerged: the scheduling of the Go runtime consumes the majority of CPU time. This might suggest the presence of a large number of goroutines in the current Go program. Upon examining the goroutine count, this indeed seems to be the case.
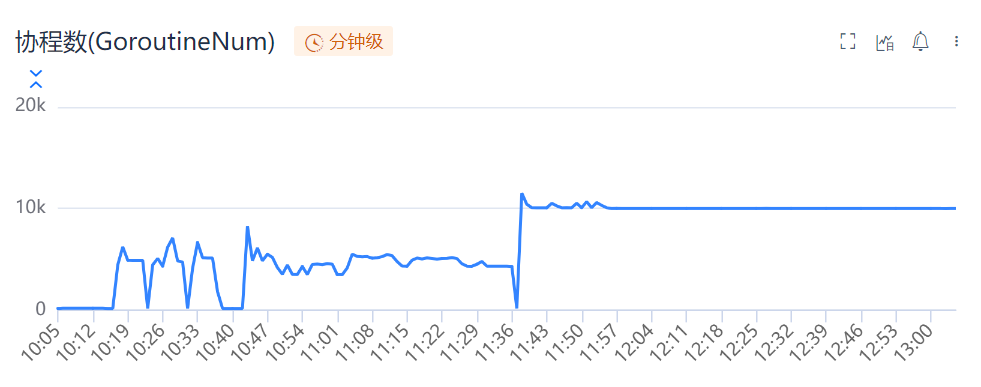
At 11:40, the number of goroutines sharply increased to 10,000 and remained relatively constant thereafter, correlating with the CPU usage persisting above 10% after 11:40. Therefore, it can be reasonably inferred that the excessive number of goroutines, which have not been released, is causing the Go runtime scheduling to consume a portion of the CPU.
In-depth Analysis
To determine how a large number of goroutines are generated, it’s necessary to utilize the pprof tool provided by Go. Unexpectedly, the majority of goroutines are associated with the github.com/apache/pulsar-client-go package. Further analysis of the relevant stacks reveals that most of these goroutines belong to producers, blocked within the producer’s event loop. This finding corroborates with the earlier observations from the flame graph.
Upon analyzing the package’s invocation hierarchy, it’s discovered that invoking the CreateProducer method is the sole method for constructing producers and executing the event loop. Furthermore, the only caller of this method is the encapsulation library used by the author. The logic for obtaining producers in this library simplifies to the following steps: 1.Attempt to retrieve from the cache. 2.Invoke the CreateProducer method provided by pulsar-client-go to obtain the producer. 3.Save the producer in the cache.
|
|
Problem Resolution
Once the problematic section of the code is identified, the issue becomes evident. When producers are not cached and obtained concurrently, it leads to concurrent requests to the CreateProducer method, resulting in the creation of numerous producers. These producers become blocked within the event loop, preventing the release of goroutines.
This problem bears resemblance to cache penetration issues, where a large number of requests penetrate to the lower layers when the cache is absent. However, unlike cache penetration, which often leads to downstream crashes, here it results in an excessive number of local goroutines that cannot be released.
Now that the solution is clear, the implementation becomes straightforward. Ensuring that the CreateProducer method is only called once concurrently solves the issue. By using the singleflight package to ensure that the CreateProducer method is only called once, similar problems are prevented from arising.